INSIGHTS
Altman Solon’s Arrow and Analytics Innovation teams developed a unique machine learning-driven approach to informed network planning, enabling clients to more accurately forecast fiber build costs. The combination of Arrow and XVision empowers clients to accelerate network deployment decisions and maximize the ROI of their network expansion.
Anyone who has undertaken a home renovation knows there is a very good chance that your project will come in late and over budget. It is also not surprising to many in the telecom sector that build-outs for one of the key networks connected to the modern dwelling – Fiber-to-the-Home (FTTH) – often come in late and over budget. While Altman Solon can’t help with your home project, we do have experience in doing so with your FTTH project – and it starts with informed network planning.
One of the greatest challenges in effectively planning a network expansion is quickly and accurately developing cost estimates. In our experience working with hundreds of network operators and investors, lacking accurate estimates results in analysis paralysis, failure to achieve ROI targets, or inability to deliver the service altogether.
One of the main drivers in accurate FTTH network planning is the labor and permitting costs required to install fiber. This cost typically accounts for over 80% of the Capex required in a standard Gigabit Passive Optic Network (GPON) architecture.
The type of routing available (e.g., buried vs. aerial) is one factor that plays a major role in the fiber installation cost. The cost per mile for buried fiber conduit is typically up to five times higher than the cost for aerial routing, which leverages existing utility poles. While there are readily available data sets for roads throughout most developed countries (e.g., Open Street Maps), there is no reliable data source on the presence of utility poles for a given road segment.
Getting the cost of fiber install right in the initial business case, and before outside plant engineering finalizes the build plan, provides multiple benefits. More accurate fiber typology (i.e., aerial vs buried) predictions can lead to optimized build costs and returns. In addition, using data that shows greater actual presence of utility poles, instead of an assumed percent mix of aerial vs. buried for a target geography, allows for more premises to pass, avoids cost overruns, and maximizes ROI for a given area.
For the initial network plan business case, many organizations often rely on high-level assumptions of percentage aerial vs. buried for a given morphology (e.g., urban service areas are 10% aerial, rural service areas are 80% aerial) and a blended cost per mile based on those assumptions. However, our research has shown that the distribution of aerial infrastructure availability can vary significantly in much more granular geospatial areas. A recent analysis of 500 census blocks across multiple morphology types in the United States showed a significant range of available aerial plant distribution (see Figure 1).
Figure 1: Number of census block groups by range of existing utility pole presence by road miles (United States)
Machine Learning for Image Classification
In order to reap the benefits of accurate fiber install costs, a more granular approach is required. The Altman Solon Analytics Innovation practice developed a unique approach, combining machine learning (ML) and FTTH network planning, to determine if utility poles are present for a given road segment. The first step involves identifying the road segment data set and using individual segments to programmatically retrieve images from the Street View API and open-source datasets (see Figure 2). A proprietary machine learning-based vision algorithm – Altman Solon XVision – is then used to classify each road segment based on the presence of utility poles. The algorithm uses image classification from convolutional neural networks to determine the presence of existing utility poles at the road segment level that may be appropriate for aerial FTTH deployment, while excluding poles that would likely not be used for FTTH (e.g., transmission towers).
Figure 2: Example street view images used for training
After training XVision on images and road segments across the United States, we observed a ~90% classification accuracy rate based on verified test data, including accurately distinguishing between utility poles and transmission towers. The XVision output helps inform and refine assumptions required for fiber builds, improving optimal routing and providing a more accurate cost estimate. XVision can also be used to predict the level of foliage near utility poles that could impact FTTH maintenance costs.
XVision Algorithm
XVision leverages ML to predict the presence of utility poles for aerial FTTH builds and/or level of foliage across a range of topographies and morphologies. To develop this proprietary approach, the Analytics Innovation team:
- Designed an ML solution, with ML model type selection, based on available data
- Trained the ML model on manually labeled images
- Cross-validated the model on manually labeled data withheld from training
- Tested the model on new images through manual inspection
Once training and sample runs were deemed to yield accurate results, the XVision algorithm is used on road segments across the entire target footprint. This includes:
- Pulling street level images for in-footprint road segments
- Classifying road segments by presence of aerial plant and/or foliage and propensity (confidence) level
- Labeling roads as aerial if algorithm predicts aerial plant presence with a degree of confidence that exceeds predefined threshold
The tagged road segment data set with predictions is then uploaded into Arrow to more accurately route fiber.
Integrated Tagged Road Edges into Arrow
Arrow, Altman Solon’s proprietary network planning platform, empowers clients to implement better network deployment strategies for 5G, fiber, and broadband, improving financial returns by more than 50%.
Arrow’s scalable data model allows users to quickly upload tagged road segments and run fiber build plans. Once uploaded, the user can leverage the data for a given plan run, instead of using a default non-tagged road segment data set (e.g., Tiger or Open Street Map). Arrow automatically assigns differential pricing to tagged road segments based on specified price book details (e.g., $20 per meter for Aerial, $65 per meter for Buried). The individual unit prices are further customizable by morphology, state, or individual service area.
Road segment tags are also visible in Arrow, allowing users with sufficient permissions to modify tags or address data gaps as needed. While the ML approach is already at ~90% accuracy, maintaining human-driven quality controls will help the algorithm inch closer to near 100% accurate outputs.
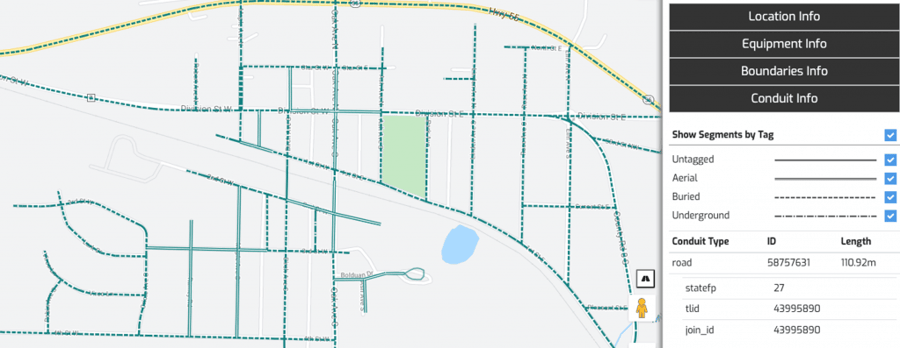
Figure 3: Viewing and adjusting road segment tags in Arrow user interface
With the updated road segment data sets, the Arrow plan design algorithm picks the most efficient route, accounting for both distance and differential cost bases, ensuring the most attractive locations can be covered at the lowest level of expense. The cost summaries cover detail by road segment type and are included in the full financial business plan for each build.
Client Impact
The Altman Solon teams have leveraged XVision and Arrow with multiple clients to help them create more accurate fiber plans. Recently, a large Telco client compared the Arrow network build opportunity using XVision inputs to a uniform aerial availability assumption (similar total aerial/buried split). With the uniform assumption, the network design suggested 20% greater Capex investment required to reach a target expansion plan. If executed against, the initial plan would have resulted in significant cost overruns and failure to deliver on the ROI target. Using Xvision inputs, the client was able to identify incremental pockets of opportunity not tapped with the uniform assumption to achieve the target coverage and ROI.
Our analysis reveals that there is limited uniformity on available conduit types for fiber routing throughout the US. Given the significant cost difference in laying down fiber by conduit type, using the most accurate data is imperative. Further, this data should be leveraged in an integrated planning approach, allowing your Network Planners to correct the data based on “truth on the ground” and incorporate any implied changes to the network design and business case for the build.
Arrow deployments, combined with our strategic insights and analytics-driven solutions, have helped leading network operators across North America, Europe, and Latin America reduce planning time from weeks to minutes, improve ROI by over 50%, and eliminate unnecessary Capex when planning for fiber to the home, enterprise, tower.
It’s time to rethink your approach to network planning and deployment with Arrow and XVision. Reach out to a member of the team today to learn more.